How do children travel to school? ITF looks at the data
The International Transport Forum (ITF) has compiled data from across the world to investigate how children travel to school.
Comprising 72 member countries, the ITF is an intergovernmental organisation which acts as a think tank for transport policy, exploring its role in economic growth, environmental sustainability and social inclusion. The ITF is administratively integrated with the OECD but remains politically autonomous.
This month, the body turned its attention to children’s journeys to school - what mode of transport do they take, what forces are at play in the decision-making and how does the reality change across borders?
A snapshot of the data
There is no standard set of comparative data on school commutes.
What the ITF has done is bring together international comparisons and country-level evidence to further understand the differences in school travel behaviour and what this could mean for policy.
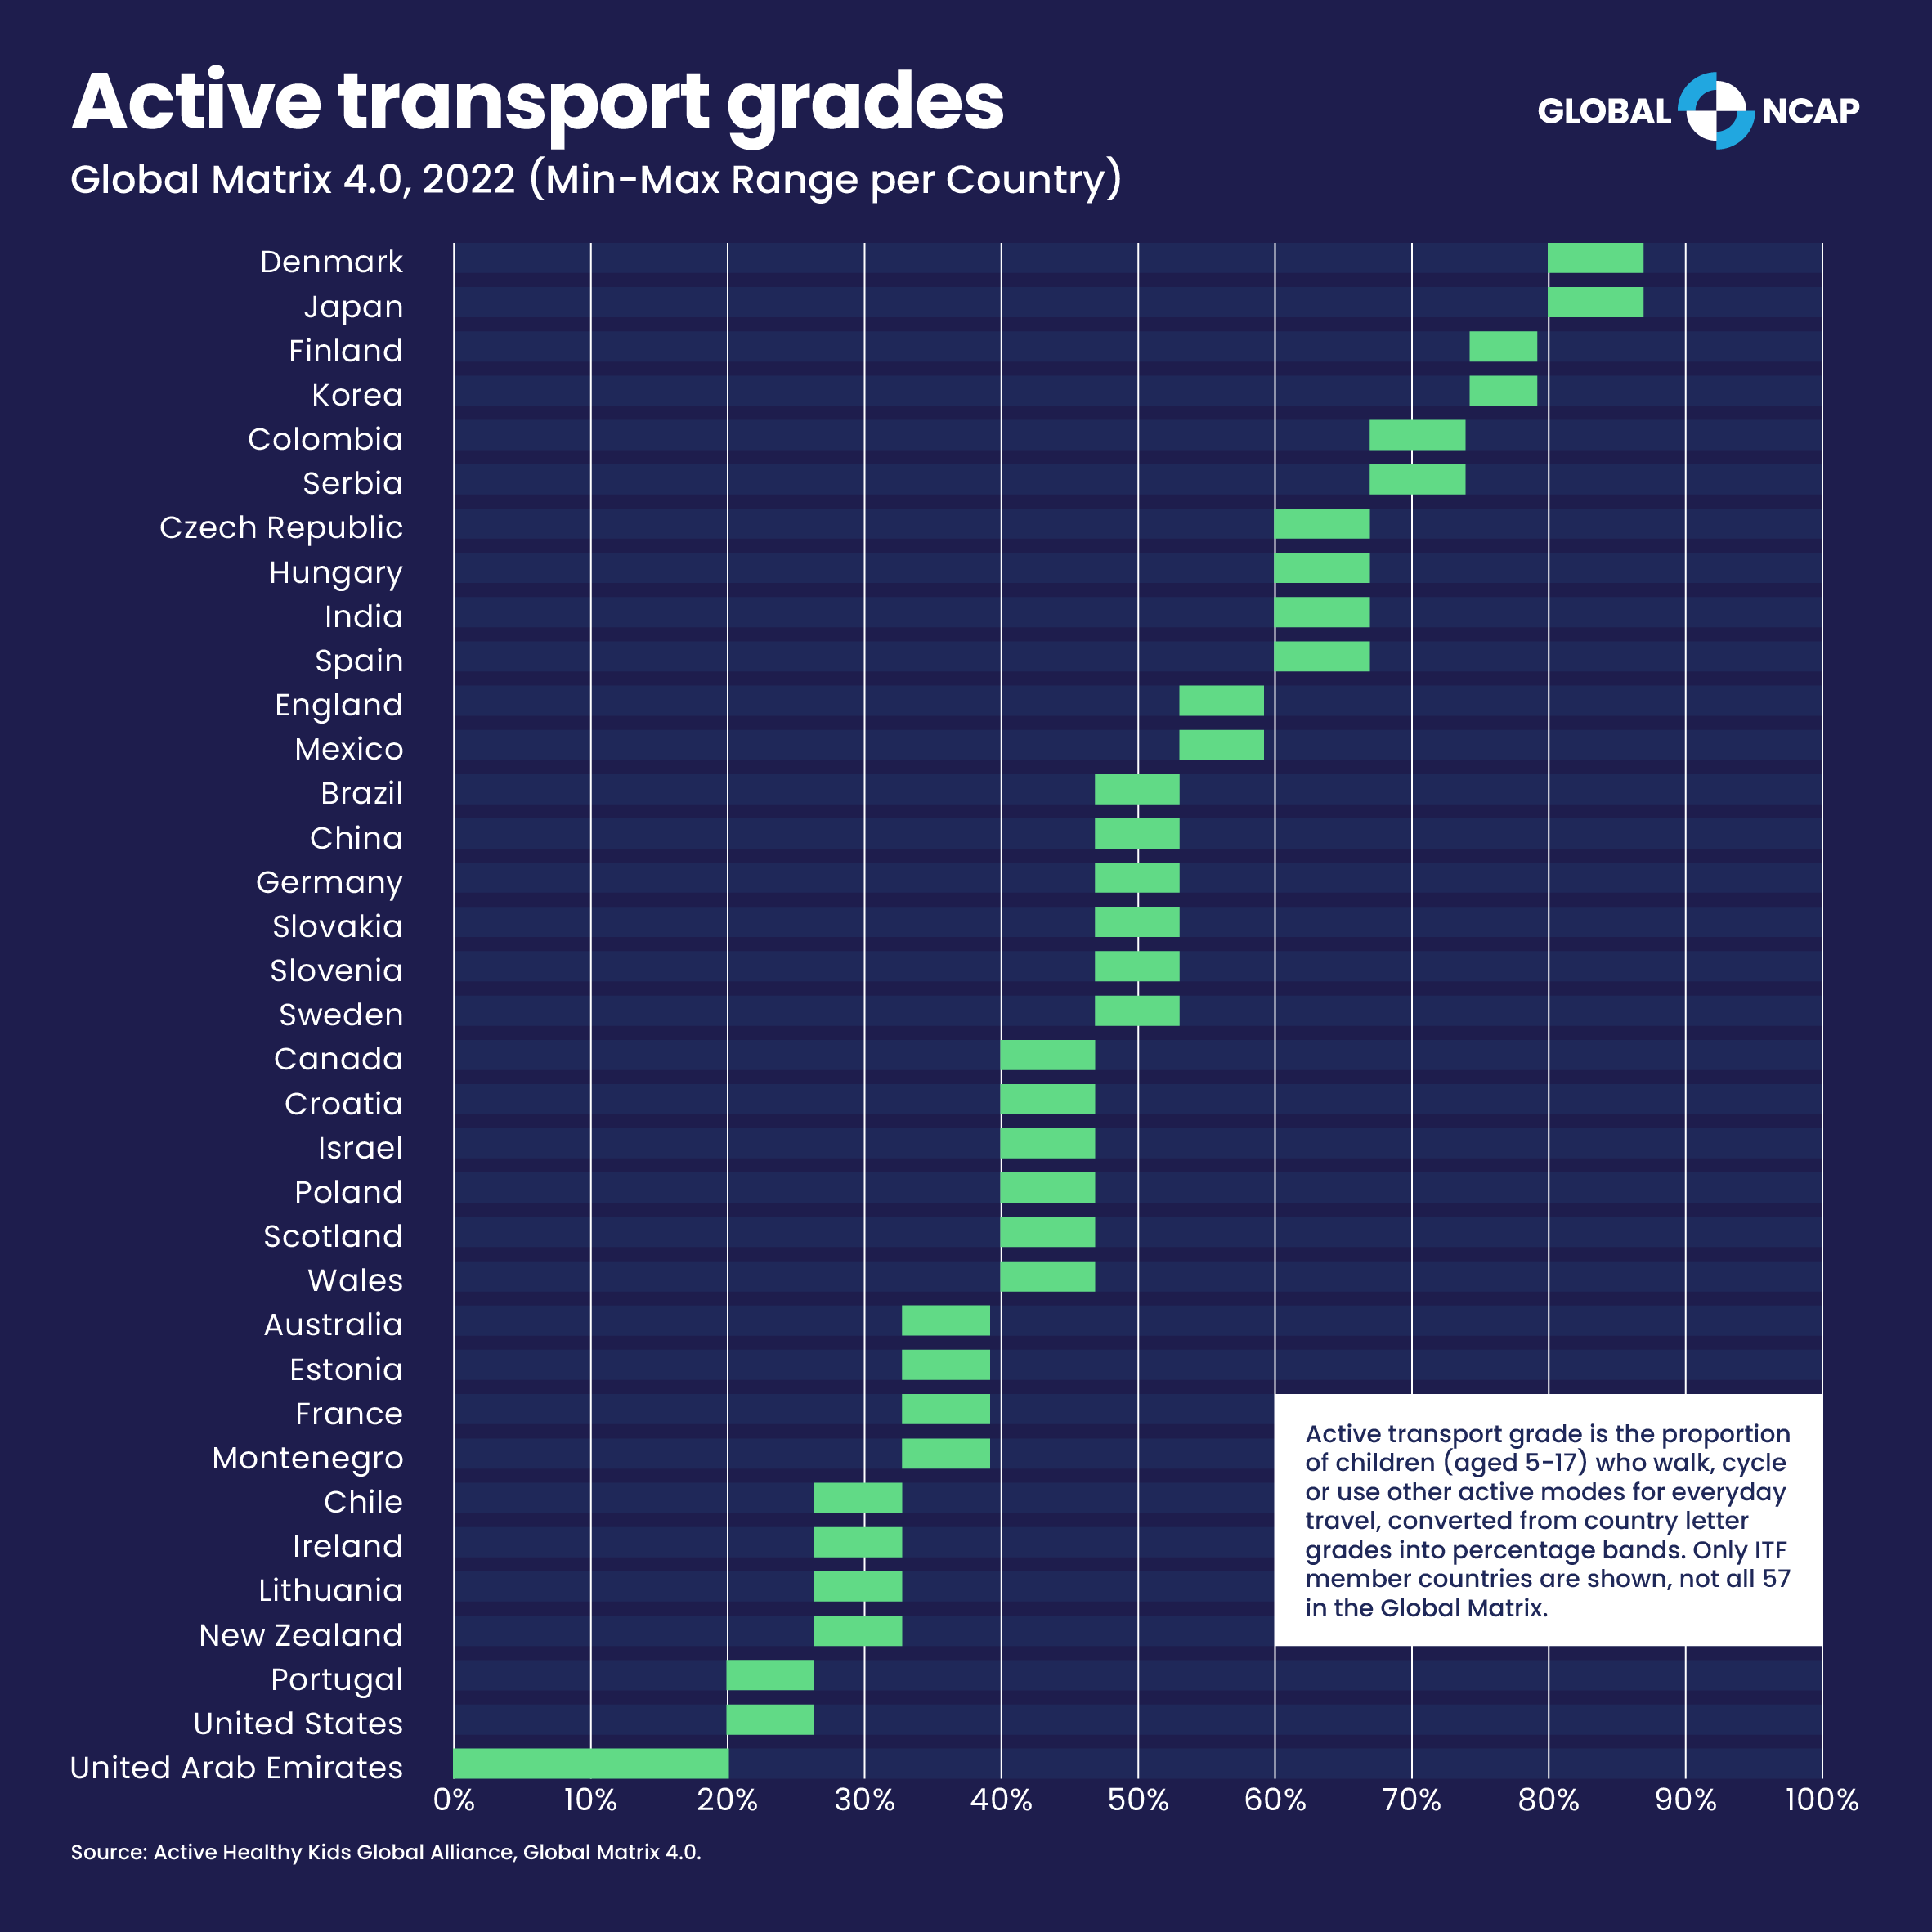
Of the 35 countries with available comparative data, more than half have at least 47% of active transport shares for children. In countries like Denmark, Japan, Finland and Korea, children have active transport shares of more than 74%.
On a cross-border comparison, walking tends to dominate cycling in several nations and regions. In Japan, more than 80% of elementary school children surveyed in 2023 were found to walk to school while cycling is rare. In Scotland, walking shares came in at just under 40% in 2025 but less than 5% for cycling.
Public transport dominates in Austria, making up more than 58% of school journeys among 10-14 year old kids in a 2013-14 study, while car travel accounted for 15.2% of school trips. For active travel, walking still dominated at 21% whilst 5.4% of school journeys were taken by bike amongst this age group.
Unsurprisingly, the Netherlands acts as a stellar example for active travel. In 2022-23, more than 47% of primary-school trips were said to be made by bicycle and 28.5% on foot, totalling to an active share of over 76%. For secondary-school pupils, cycling alone reached 81.3% of trips.
The US demonstrates how school travel patterns change over time. In 1969, the share of primary and lower-secondary students travelling to school by car was 12%. This rose to 50% in 2017. On the opposite side of the spectrum, e-bike usage among secondary-school pupils in the Netherlands rose from 3.2% of school trips in 2018-19 to over 11% in 2022-23.
What’s coming into play here? According to the ITF study, shorter distances, age, safer neighbourhoods and roads and having a companion all increase active travel shares. In England, younger children (aged 5 to 10) mostly walk (51%) or are driven (43%) to school. Older children (aged 11 to 16) rely more on the bus, with this trend especially prevalent for longer distances where buses represent 58% of trips of five miles or more.
In Hungary, a 2022-25 survey found that 61% of lower-primary students said they usually travel to school by car, compared with 39% in upper primary and 21% in secondary school. In the Netherlands, the active share among primary-school children is 92% for trips of 1 km or less, 78% for 1 to 2 km and 54% for 2 to 5 km, demonstrating the impact of distance.
Commutes can also be influenced by how families make their decision on which school to send their child to in the first place. In Quebec, Canada, research found that the average home-school distance of private schools is almost four times that of public schools. When children are in schools that are further away from home, the transport system tends to rely more on motorised travel.
What action should we take from here?
School commutes are concentrated in narrow morning and afternoon windows which can strain the transport system. In London, a three-year average found that 27% of morning peak car-driver journeys are associated with school drop-offs while, in Beijing, one study found that school runs increase the probability of road congestion by 4.5 percentage points. A strained transport system doesn’t just apply to motorised travel. In the Netherlands, children travelling to school make up to 40% of all cyclists in the morning peak hour.
One solution the ITF presented to ease the strain is staggered school start times. Staggering start times across schools or year groups could spread the traffic and potentially reduce pressure on infrastructure. The approach has been piloted at large schools in Barbados, with the government reporting reduced congestion in high-traffic areas and exploring a broader national rollout. Sweden concluded similar results, though the ITF highlighted that implementation must account for impacts on school operations, pupils, teachers and families.
The research finds that nations and regions are often creating a car-first feedback loop that’s hard to change. In rural Scotland, cars dominate school trips because road design and parking facilities make driving convenient. This reflects the “build it and they will come” mindset but in the less conventional direction - building for expected car growth will induce that growth.
The ITF proposes a series of interventions to tap into that feedback loop. These include pedestrianising school streets and restricting motor vehicles around nurseries and primary schools. The aim is to support active travel and make young people feel safer when they choose to walk and it’s an approach that has been vividly demonstrated by cities like Paris.
Safe infrastructure also needs investment - this means well-marked crossings, good sightlines, reduced speed limits and separate paths for pedestrians and cyclists. Greece has worked to improve the visibility of pedestrian crossings through its Safe Roads Project which partners with local authorities and schools, and routes are already showing improved safety.
Though less conventional, the “walking school bus” has also proved effective in increasing active travel shares. This idea mimics a bus but by foot, with an adult volunteer walking a set route to school and picking children up along the way. A pilot of fourth-grade pupils in the US found that the walking school bus increased active commuting from 23.8% to 54% over the study period. A “bike bus” works on the same principle, with these initiatives growing in cities like Barcelona.
Alongside other public interventions - like subsidising transport systems - we’ve seen the impact when action comes directly from the industry. Global NCAP’s friends at iRAP run the Star Rating for Schools (SR4S) programme which measures the safety and risk of traffic and road infrastructure surrounding a school journey. The body then ranks this on a scale of one to five.
As of December 2025, the programme has protected more than 515,000 students through safer upgrades across 2,475 schools in 84 countries. Just under 9,000 partners have been trained and nearly US$12 million has been invested, demonstrating the impact of the industry keeping authorities and institutions accountable as we collectively strive to end road deaths across the world.